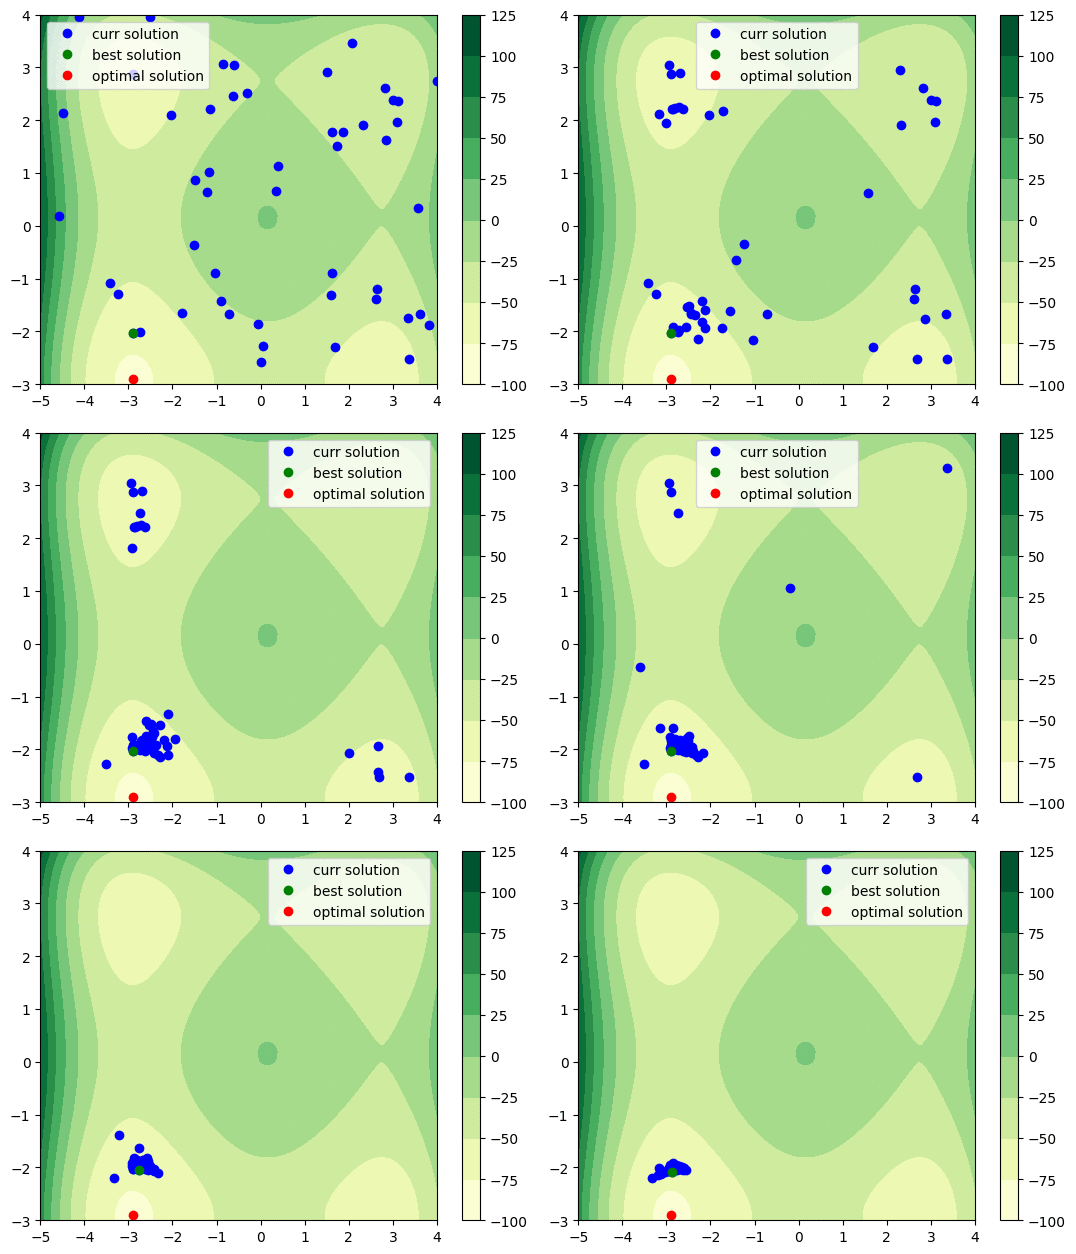
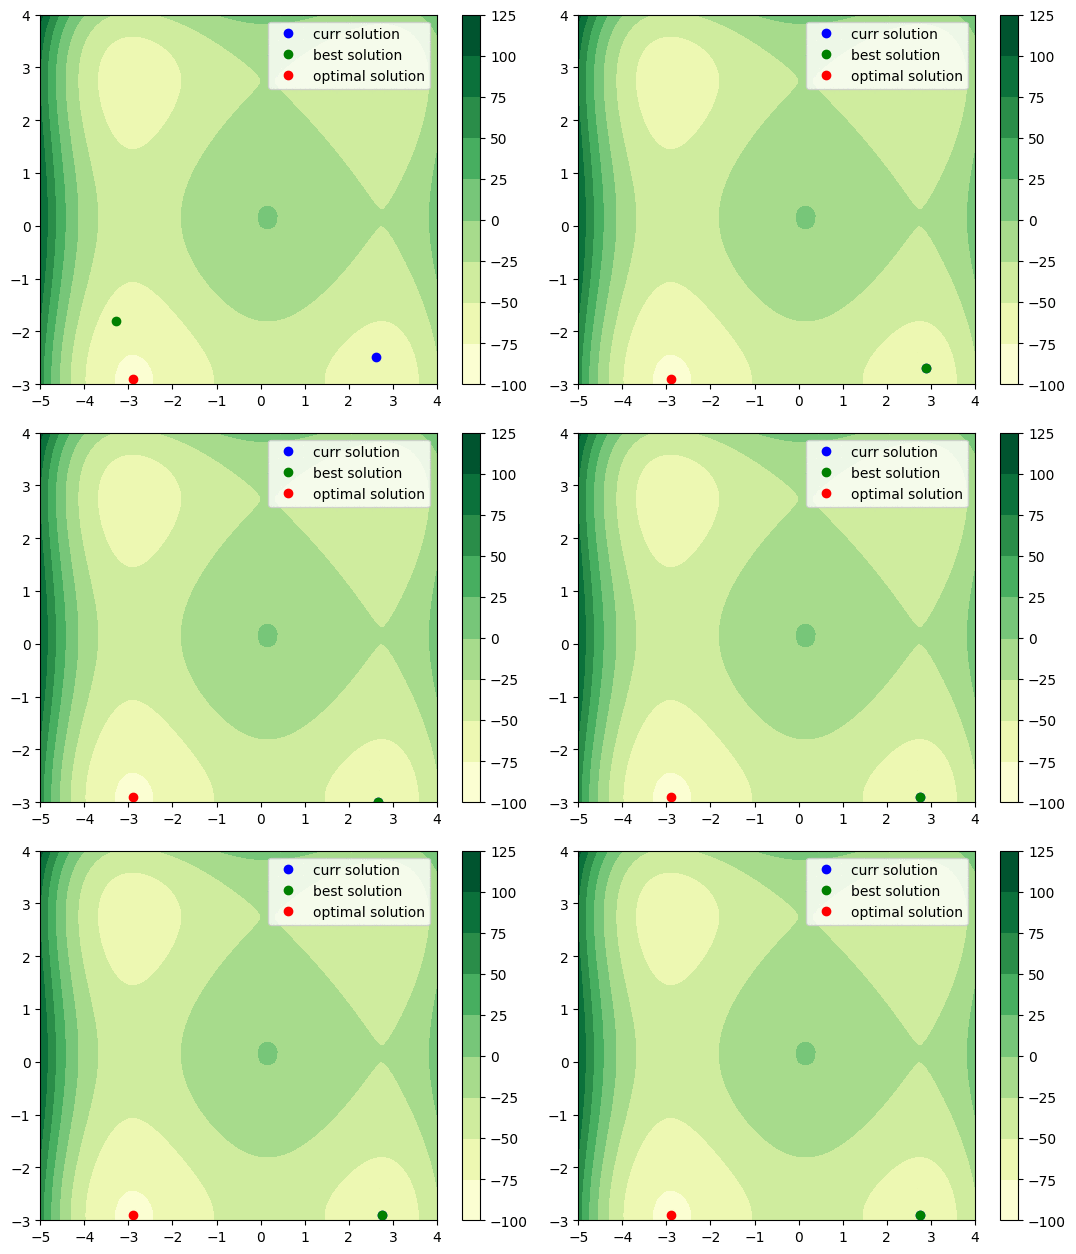
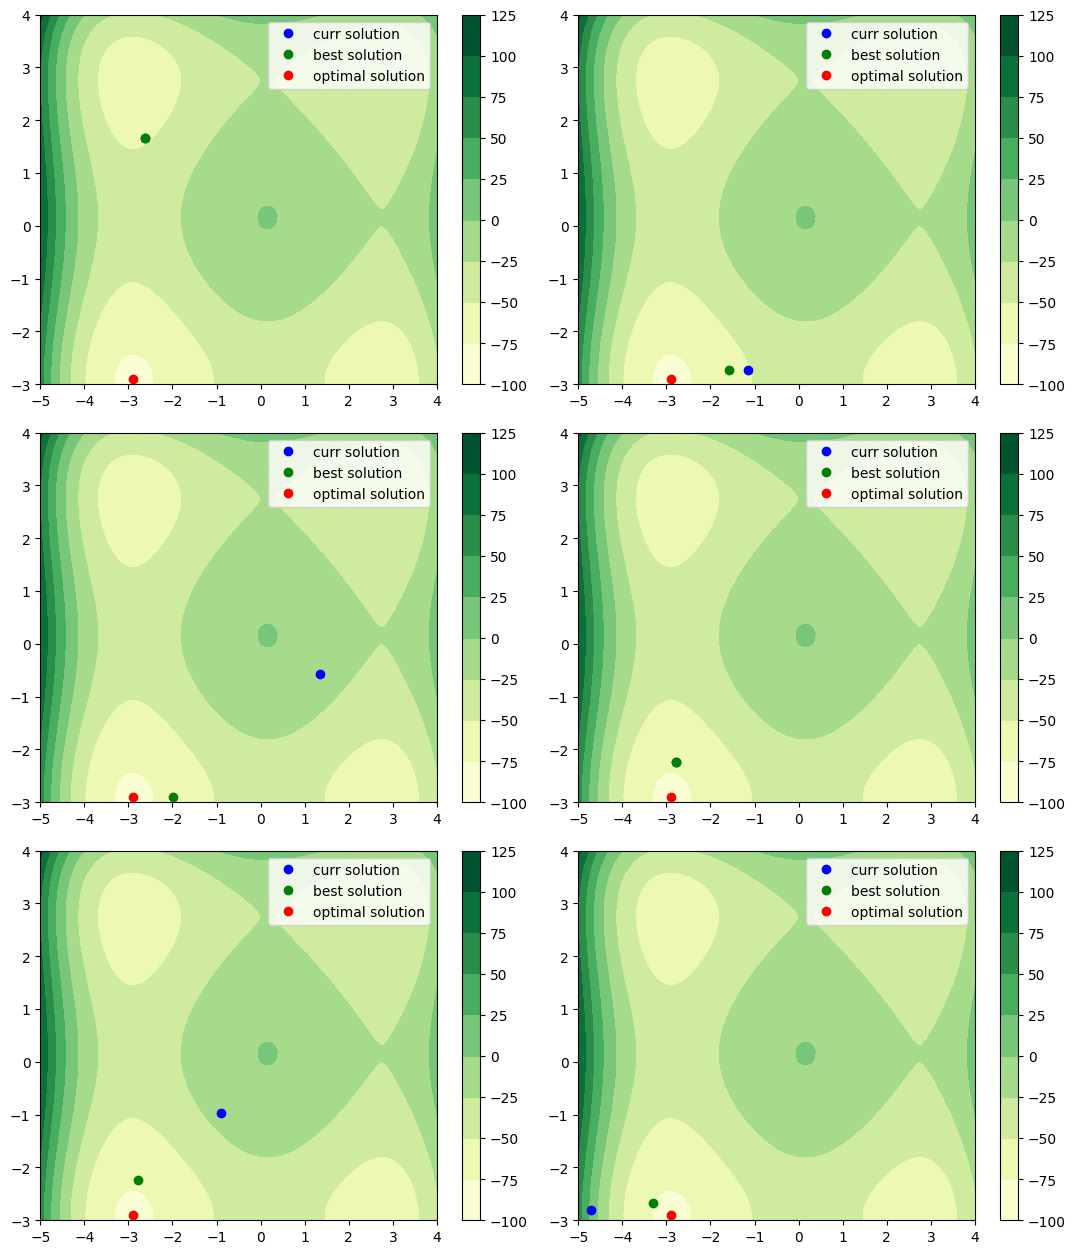
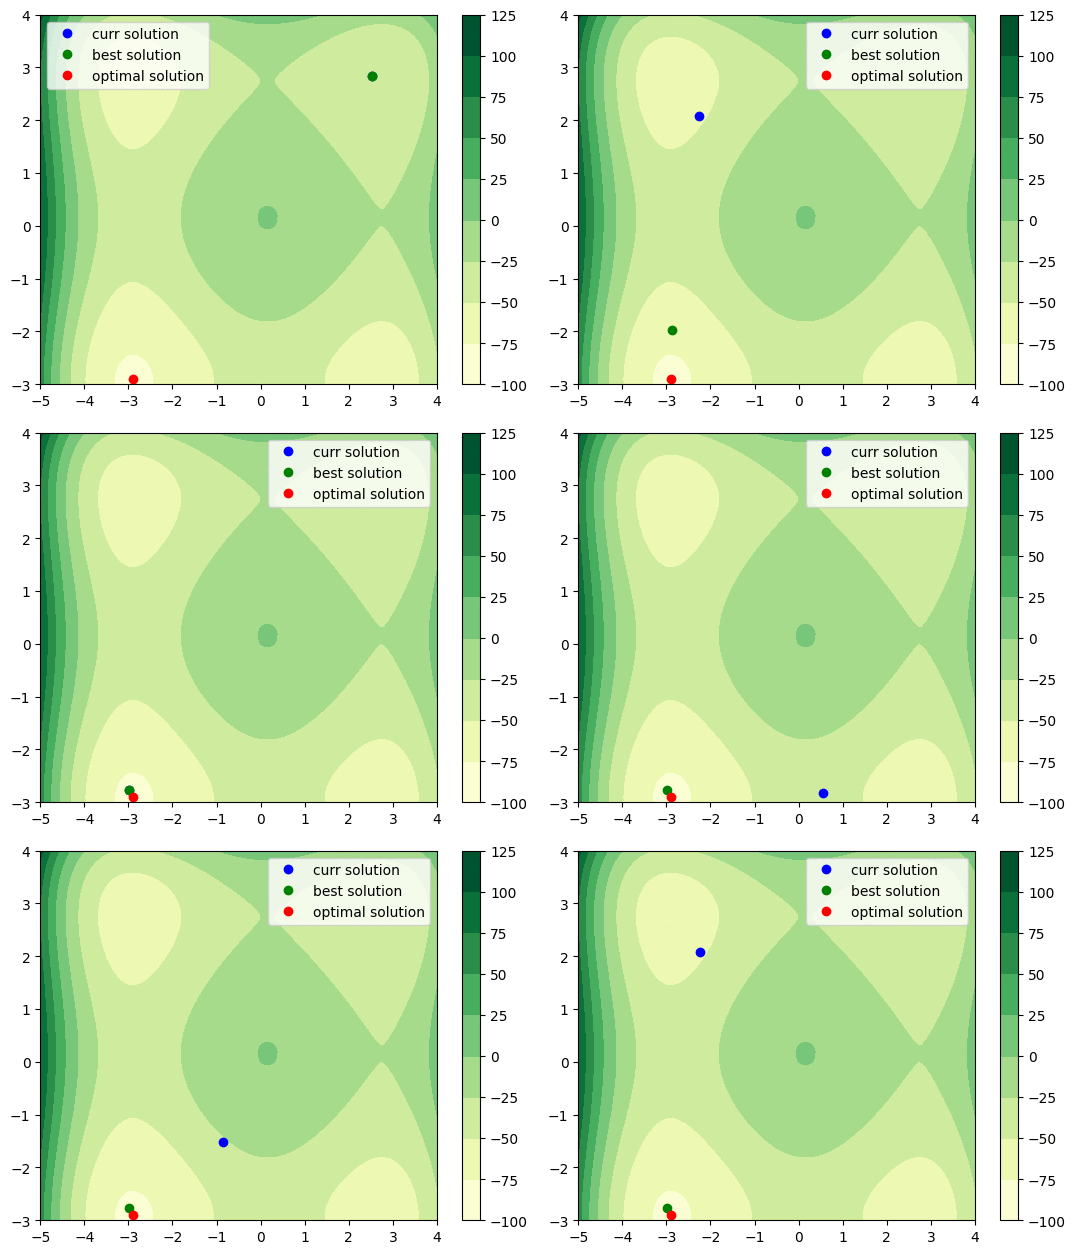
Plot Search Points
We can plot search points to use callback option of Solver.
SFLA

ScipySearch

OptunaTPESearch

RandomSearch

import os

import numpy as np
import matplotlib.pyplot as plt

import flopt
from flopt import Variable, Problem, Solver, CustomExpression

class Plot2DFunc:
    def __init__(self, func, xlim, ylim, opt=None, save_prefix=None):
        self.ix = 0
        self.func = func
        self.xlim = xlim
        self.ylim = ylim
        self.opt = opt
        self.save_prefix = save_prefix
        self.fig, self.ax = plt.subplots()

        # plot contour of func
        im = self.plotFunc(self.ax)
        self.fig.colorbar(im)

    def plotFunc(self, ax):
        # X, Y, Z
        interval = 0.1
        x = np.arange(self.xlim[0], self.xlim[1]+interval, interval)
        y = np.arange(self.ylim[0], self.ylim[1]+interval, interval)
        Z = np.zeros((len(y), len(x)))
        for x_ix in range(len(x)):
            for y_ix in range(len(y)):
                Z[y_ix, x_ix] = self.func(x[x_ix], y[y_ix])
        X, Y = np.meshgrid(x, y)
        im = self.ax.contourf(X, Y, Z, cmap='YlGn')
        return im

    def plot(self, solutions, best_solution, best_obj_value):
        # solution
        x = [solution[0] for solution in solutions]
        y = [solution[1] for solution in solutions]
        self.ax.plot(x, y, 'o', label='curr solution', color='blue')

        # best solution
        x, y = best_solution[0], best_solution[1]
        self.ax.plot(x, y, 'o', label='best solution', color='green')

        # optimal solution
        if self.opt is not None:
            x, y = opt
            self.ax.plot(x, y, 'o', label='optimal solution', color='red')

        self.ax.legend()


    def savefig(self):
        if self.save_prefix is not None:
            filename = self.save_prefix + f'{self.ix:0>5d}' + '.png'
            self.fig.savefig(filename, bbox_inches='tight')
            self.ix += 1


    def __call__(self, solutions, best_solution, best_obj_value):
        self.plot(solutions, best_solution, best_obj_value)
        self.savefig()
        self.ax.lines = list()  # remove scatter points


if __name__ == '__main__':
    from math import sin, sqrt
    def test_func(x1, x2):
        return sum(x**4-16*x**2+5*x for x in [x1, x2]) /2

    xlim = (-5, 4)
    ylim = (-3, 4)
    opt = (-2.903534, -2.903534)
    x = Variable(name=f'x', lowBound=xlim[0], upBound=xlim[1], cat='Continuous')
    y = Variable(name=f'y', lowBound=ylim[0], upBound=ylim[1], cat='Continuous')


    prob = Problem()
    prob += CustomExpression(test_func, [x, y])

    algos = [
        'Random',
        'OptunaTPE',
        'OptunaCmaEs',
        'Hyperopt',
        'SFLA',
        'Scipy'
    ]
    for algo in algos:
        x.setRandom()
        y.setRandom()
        os.makedirs(algo, exist_ok=True)
        plot_2d_func = Plot2DFunc(
            test_func, xlim, ylim, opt=opt, save_prefix=f'./{algo}/'
        )
        solver = Solver(algo=algo)
        solver.setParams(n_trial=50, callbacks=[plot_2d_func])
        prob.solve(solver, msg=True)
In addition, you can use imagemagick, you can create gif animation from images to run
convert -layers optimize -loop 0 -delay 40 *.png search.gif
in each solver directory.